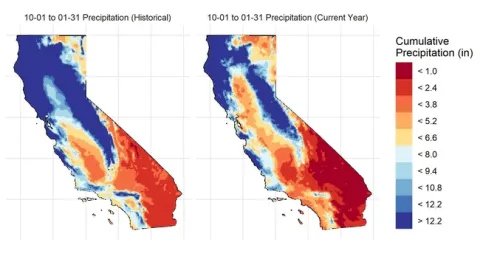
Weather patterns are highly variable across the state of California. They change from year to year and across locations. While parts of the state may be experiencing drought conditions this year (Figure 1), each location can have dramatically different weather. For growers and agronomists, location-specific weather information is essential to understand plant growth and water use. It is also important for planning field management activities such as fertilization and irrigation.

We have created a new interactive website where users can access their location-specific precipitation and temperature data:
http://smallgrains.ucanr.edu/General_Production/weather/
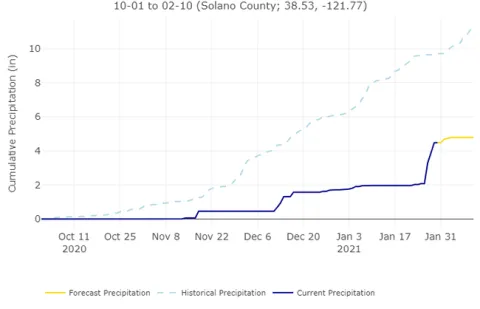
Here, users can choose a specific location and enter a date range of interest. The website uses these inputs to produce interactive graphs of precipitation and temperature patterns. The graphs show the historical (10-yr average) and current season data making it easy to compare this season to other seasons and to see changes over time. Forecasts are also available in the main crop-growing regions of California (e.g. Figure 2). Users can also download their location-specific data for further exploration.


