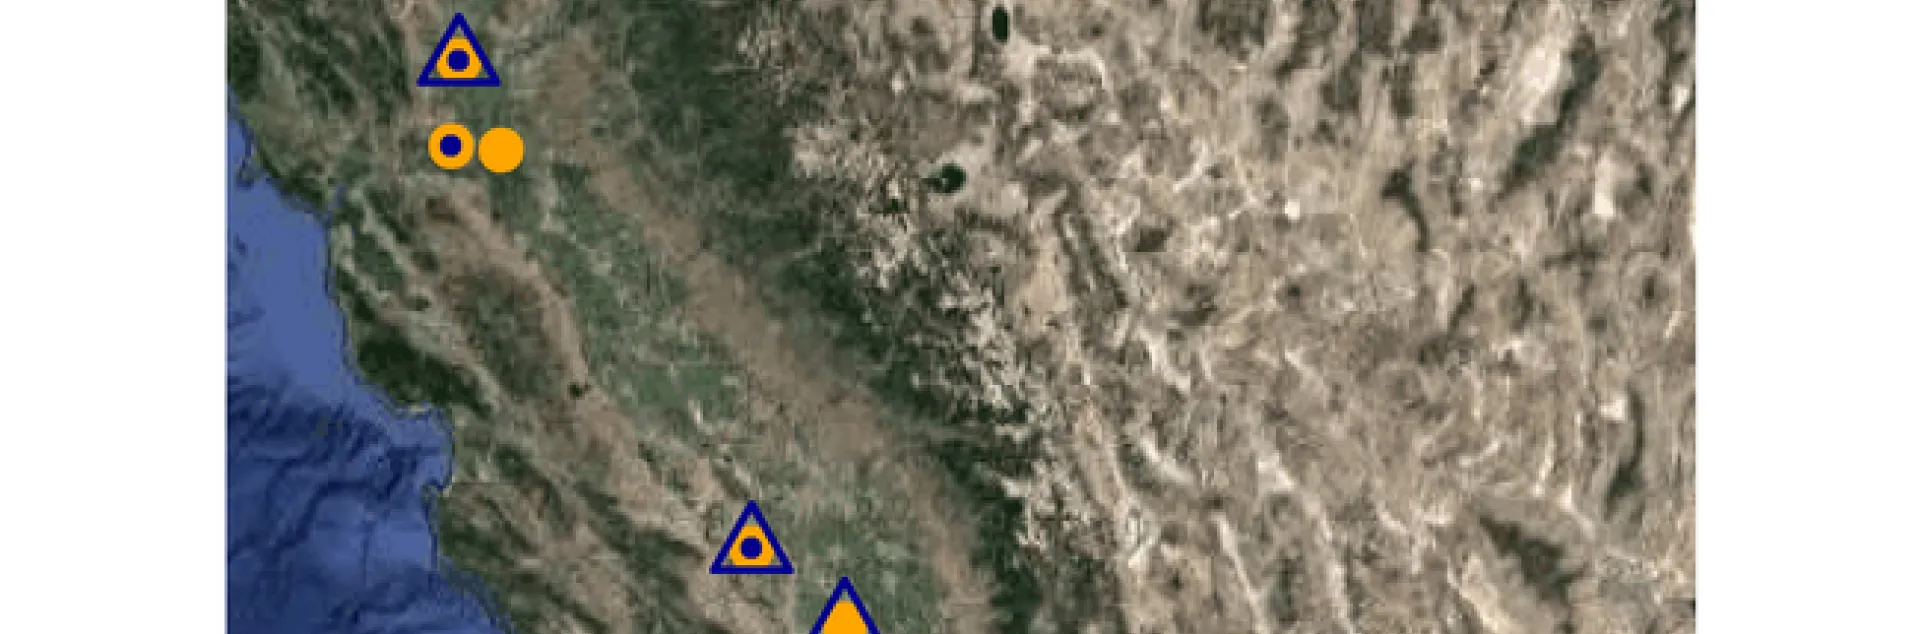
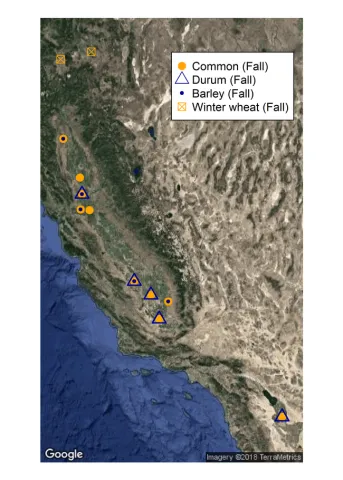
The UC Grain Cropping Systems Lab and a cooperating network of UC Cooperative Extension agronomists established fall-planted small grain variety trials across the state of California from October to December 2017. These included: 10 locations with fall-planted common wheat (predominantly hard spring types) and triticale varieties; 5 locations with durum wheat varieties; 5 locations with barley varieties; and 2 locations with winter-type common wheat.
Precipitation has been below average and growing degree days (GDD) have been above average at the fall-planted trial locations during the first 6-8 weeks of growth. To see graphs of the precipitation accumulation since 10/1/2017 at the nearest CIMIS stations to each fall-planted, common spring wheat trial site, follow the links below. Graphs of the cumulative GDD at these sites since the effective planting date of the trials at those sites are also available. The locations are ordered from north to south across the network of common spring wheat trials.
Tehama (rainfed): Precipitation | GDD
Colusa: Precipitation | GDD
Davis: Precipitation | GDD
Solano (rainfed): Precipitation | GDD
Delta: Precipitation | GDD
Fresno: Precipitation | GDD
Kings: Precipitation | GDD
Tulare (rainfed): Precipitation | GDD
Kern: Precipitation | GDD
Imperial: Precipitation | GDD
To help with interpreting the relationship between the cumulative GDD and stages of growth for a common spring wheat variety with an average rate of growth and maturity in California, we made periodic observations of growth stages at the Davis location in the 2016-17 season. The compiled table (below) is based on these relationships. The growth stage x GDD accumulations below generally agree with similar data produced by the University of Arizona in Maricopa, AZ and available in Table 1 here. Click here for a visual representation of the growth stages.
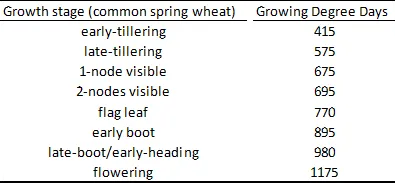
Table 1. Depicts the relationship between cumulative growing degree days calculated with 86/45F max/min and stages of growth for a common spring wheat variety with averages rates of development based on the 2016-17 season in Davis, CA. Visual representations of stages are available here.
We encourage readers to check out another recent post on stand counts and related thoughts on topdressing N fertilizer here. We'll check back in with notes and/or data of interest as the season progresses. Best wishes for a successful 2018!